High oxygen concentration type activated sludge process – no excess sludge
村上定瞭(水浄化フォーラム), Sadaaki Murakami (Water & Solutions Forum)
活性汚泥法の総目次
Ⅰ. 活性汚泥法とは
Ⅱ. 基本設計・操作因子
Ⅲ. 回分型-室内実験
Ⅳ.連続型-室内実験
Ⅴ.活性汚泥の悪化と対策-室内実験
Ⅵ.高酸素濃度型-余剰汚泥なし(本ページ)
Ⅶ.汚泥減量型
Ⅷ.膜分離型-室内実験
Total table of activated sludge process
Ⅰ. What is the activated sludge process?
Ⅱ. Basic design and operation factors
Ⅲ. Batch type – indoor experiment
Ⅳ. Continuous type – indoor experiment
Ⅴ. Deterioration of activated sludge and countermeasures
Ⅵ. High oxygen concentration type – no excess sludge (this page)
Ⅶ. Sludge reduction type
Ⅷ. Membrane separation type – indoor experiment
1.はじめに
生活系排水など、微生物を用いた生物法では、汚濁物質を摂取した微生物が増殖するため、この増殖した微生物(汚泥)の処理・処分が必要となる。
家庭排水を例に上げると、1日1人当たりの排水量200L、そのBODを40g/人とし、生物処理における汚泥変換率0.5~0.8とすると、生成する汚泥量は20~30g/日/人となる。含水率98.5%の濃縮汚泥に換算すると、1.3~2.1L/日/人となり、5人家族で1年間では2.4~3.8m3もの汚泥が発生することとなる(図1)。
1. Introduction
In a biological method using microorganisms such as domestic wastewater, microorganisms that ingest pollutants grow, and therefore it is necessary to treat and dispose of the grown microorganisms (sludge).
Taking domestic wastewater as an example, the amount of wastewater per person per day is 200L and its BOD is 40g/person, and if the sludge generation rate in biological treatment is 0.5 to 0.8, the amount of sludge produced will be 20 to 30 g/day/person. When generated to concentrated waste (or excess) sludge with a water content of 98.5%, it will be 1.3 to 2.1 L/day/person, and a family of five will generate 2.4 to 3.8 m3 of sludge in one year (Fig.1).
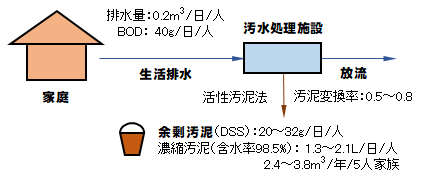
図1 生活排水の浄化に伴う汚泥の発生量
Fig.1. Amount of sludge generated by purification of domestic wastewater in Japan.
酸素曝気型活性汚泥の歴史は古く,実施設例も少なくない[2]。本法は、1) 高負荷・負荷変動に対して安定、2) 沈降・凝集性に優れ、バルキングがない、3) 余剰汚泥の生成量が少ないなどの特徴がある。
以上の背景を踏まえて、次の目的で実験を行った。
1) 酸素濃度を高く保持する(DO>10mg/L)ことにより、活性汚泥の増殖速度と自己分解速度が等しく、かつ、その状態が安定に保持できるかどうか。
2) その安定な系の活性汚泥を構成する微生物群の種類は、標準の活性汚泥(DO:1~数mg/L)を構成するものと異なるものかどうか、遺伝子解析により確認すること。
3)数年間にわたる実験の結果、DO>15mg/L以上の条件で、余剰汚泥の発生しない系が成立し、その微生物群の構成は標準型のものと種類が異なることが確認できた(図2)。
Oxygen aeration type activated sludge has a long history and many examples have been implemented [2]. This method has the following features: 1) Stable against high load and load fluctuation, 2) Excellent sedimentation and cohesiveness, no bulking, and 3) Small amount of excess sludge produced.
Based on the above background, experiments were conducted for the following purposes.
1) Whether keeping the oxygen concentration high (DO > 10mg/L) makes the growth rate of the activated sludge equal to the self-decomposition rate and keeps the the sludge state stable.
2) Confirm by genetic analysis whether the types of microorganisms that make up the oxygen activated sludge are different from those that make up the standard one (DO at 0 to several mg/L).
3) As a result of experiments over several years, it was confirmed that a system that does not generate excess sludge was established under conditions of DO > 15 mg/L or more, and that the composition of the microbial community was different from the standard type (Fig. 2).
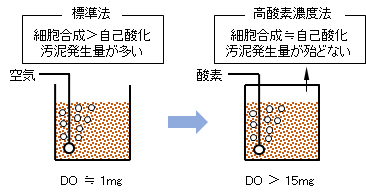
図2 標準および高酸素濃度の活性汚泥法の比較
Fig.2. Comparison between standard and high oxygen concentration activated sludge processes.
2.実験方法
(1)実験装置
実験システムの概略を図3に示す。曝気槽、沈殿分離槽(以下、沈殿槽)、汚水供給、酸素ガス供給から構成される。同じ構成の実験装置を用いて、酸素曝気系と空気曝気系の2系列を稼働した。
(a)曝気槽
曝気槽は、有効容積3Lの密封ガラス製容器で、温度を一定に保つために恒温水(25℃)を循環できる構造となっている。
汚水・酸素ガスの供給、曝気槽から沈殿槽への送液、分離汚泥から曝気槽への汚泥返送は、全て、曝気槽上部から内部に向けてゴム栓で装着したステンレス管(内径3mm)にシリコンチューブ(内径3mm)を接続して行った(写真1・右)。
(b)沈殿分離槽
有効容積3Lの三角錐型沈殿槽で、分離汚泥は全て曝気槽へ返送した。
(c)送液ポンプ
汚水供給ポンプは、小型ダイヤフラム定量ポンプで6L/日(Q)に設定し、曝気時間(汚水滞留時間)は12hとした。
曝気槽から沈殿槽への混合液の移送は、先端を曝気槽水位(3L)の位置に固定したステンレス管に接続したチューブ定量ポンプにより、送液量2.5Qに設定して、流入量に対応した量の混合液を吸引・移送し、曝気槽内の水位を一定に保った。
沈殿槽で分離した汚泥は、チューブ定量ポンプにより、流量Qで曝気槽へ返送した。
(d)曝気槽内DO制御
小型の密封型曝気槽で、DOセンサを槽内に浸漬できないことと保守管理の視点から、混合汚泥の検液をDO測定セット(図4)に循環してDO測定を行った。曝気槽内のDOは、酸素ボンベ(減圧・流量調整器付き)に接続した電磁バルブを開閉して酸素ガスを供給し、DOを所定の値に設定した。空気曝気系は、酸素ボンベの代わりにダイヤフラム式ポンプを置き換えた構成で実験した。
2. Experimental
(1) Experimental device
The outline of the experimental system is shown in Fig.3. It consists of an aeration tank, a settling tank, sewage supply, and oxygen gas supply. Two series of oxygen aeration system and air aeration system were operated using the experimental equipment of the same structure.
(a) Aeration tank
The aeration tank is a sealed glass container with an effective volume of 3L and has a structure that can circulate the constant temperature water (25°C) to keep the bio-reaction temperature constant.
The supply of sewage and oxygen gas, liquor transfer from the aeration tank to the settling tank, and separated sludge return from the settling tank to the aeration tank were carried out with each silicon tube (inner diameter 3 mm) by connecting to a stainless steel tube (internal diameter 3mm) which pass through a rubber plug from the top of the aeration tank to the inside.(Photo 1, right).
(b) Settling tank
Effective volume 3L triangular pyramid type settling tank, all settled sludge was returned to the aeration tank.
(c) Liquid transfer pump
The sewage supply pump was a small diaphragm metering pump set to 6L/day (Q) and the aeration time (sewage residence time) was set to 12h.
Transfer of the mixed liquor from the aeration tank to the settling tank can be adjusted to 2.5Q by the tube metering pump connected to the stainless steel tube whose tip is fixed at the water level (3L) of the aeration tank, and corresponds to the inflow quantity. The amount of the mixed liquor was sucked and transferred to keep the water level in the aeration tank constant.
The sludge separated in the settling tank was returned to the aeration tank at the flow rate Q by the tube metering pump.
(d) DO control in the aeration tank
In a small sealed aeration tank, from the viewpoint of not being able to immerse the DO sensor in the tank and from the viewpoint of maintenance management, the DO of the mixed liquor was circulated to the DO measurement unit (Fig.4) for DO measurement. DO in the aeration tank was set to a predetermined value by opening and closing an electromagnetic valve connected to an pure oxygen cylinder (with decompression valve and flow rate regulator) to supply oxygen gas. The air aeration system was tested with a configuration in which a diaphragm pump was replaced in place of the pure oxygen cylinder.
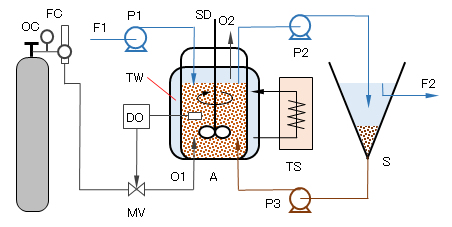
図3 高酸素濃度型活性汚泥法の室内実験装置の概要
A:曝気槽(3L)、S:沈殿槽(3L)、SD:攪拌機、F1:供試原水、F2:放出水、P1~P3:定量ポンプ、OC:純酸素ボンベ、O1:酸素供給、O2:ガス排出、FC:減圧・流量調整器、DO:DO計測制御器、MV:電磁バルブ、TW:恒温循環水、TS:恒温水槽
Fig.3. Outline of indoor experimental equipment for high oxygen concentration type activated sludge process.
A: Aeration tank (3L), S: Settling tank (3L), SD: Stirrer, F1: Test raw water, F2: Discharged water, P1 to P3: Metering pump, OC: Pure oxygen cylinder, O1: Oxygen supply, O2 : Gas discharge, FC: Pressure reduction/flow rate regulator, DO: DO measurement controller, MV: Electromagnetic valve, TW: Constant temperature circulating water, TS: Constant temperature water tank.
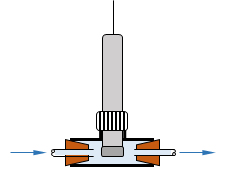
図4 溶存酸素濃度測定センサーのユニット
T字塩ビ管継手に、DOセンサーと検液循環チューブを装着したもの
Fig.4. Unit of dissolved oxygen concentration measurement sensor.
T-shaped PVC pipe fitting with DO sensor and test linquor circulation tube.
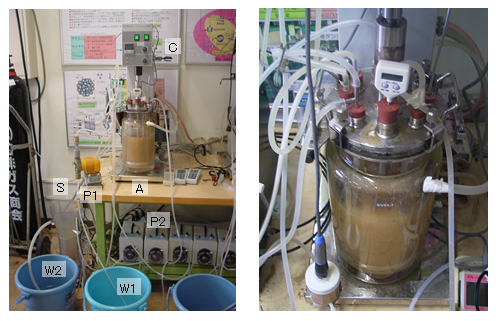
写真1 実験装置の様子
(左)装置全景、A:曝気槽、S:沈殿槽、W1:汚水貯留槽、W2:処理水槽、P1:汚水供給ポンプ系、P2:送液ポンプ群、C:制御系;(右)曝気槽
Photo 1. Experimental equipment
(Left) Overall view of the equipment, A: Aeration tank, S: Settling tank, W1: Waste water storage tank, W2: Treated water tank, P1: Waste water supply pump system, P2: Liquid transfer pump group, C: Control system; (Right) Aeration Tank.
(2)供試汚水
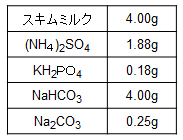
実験には、有機物としてスキムミルクを、pH調整剤(処理水のpH6.5以上を保持)としてNaHCO3-Na2CO3を成分とする模擬生活排水を用いた(表1)。この汚水の汚濁指標(mg/L)は、BOD 200、COD 200、TOC 160、TN 64、TP 4.1である。曝気槽3Lに対して300mg-BOD/Lを6L/dとしたので、容積負荷は0.4kg-BOD/m3である。
(2) Sample sewage
In the experiment, skim milk was used as the organic substance, and simulated domestic wastewater containing NaHCO3-Na2CO3 as the pH adjuster (holding the treated water at pH 6.5 or higher) was used (Table 1). The pollution index (mg/L) of this sewage is BOD 200, COD 200, TOC 160, TN 64, TP 4.1. Since 300 mg-BOD/L was set to 6L/d for 3L of aeration tank, the volumetric load was 0.4kg-BOD/m3.
Table 1. Components of simulated wastewater (in 10L of tap water).
(3)運転管理
毎日とは、正月・盆を含む全ての祝日にも、保守点検を行った。
(a)供試汚水
毎日、10Lの供試汚水を調整した。
(b)実験装置の保守点検
毎日: 各送液ポンプの稼働状況、チューブ系の破損・閉塞・漏洩、酸素ガスの供給状況、曝気槽・沈殿槽の状況、処理水中の流出汚泥など、点検を行い、適宜対応した。
(c)測定項目
曝気槽の容量が少ないので、測定用の活性汚泥の採取量はなるべく少ない量とした。
毎日: pH、DO
毎週3回(月、水、金): MLSS(安全ピペッター装着25mLホールピペット用いて、曝気槽から直接採取)
毎週1回(水): 活性汚泥の沈降特性(100mL試験管に70mL採取して測定)、処理水中のBOD、TOC
(3) Operation management
Every day, we also performed maintenance inspections on all public holidays, including New Year and Bon Festival periods.
(a) Test sewage
Prepared 10L of test sewage every day.
(b) Maintenance and inspection of experimental equipment
Every day: The operation status of each liquid delivery pump, tube system damage/blockage/leakage, oxygen gas supply status, aeration tank/settling tank status, sludge in treated water, etc. were inspected and taken appropriate action.
(c) Measurement item
Since the aeration tank has a small capacity, the amount of activated sludge for measurement was set as small as possible.
Everyday: pH, DO
Twice a week (Monday, Wednesday, Friday): MLSS (Use a 25 mL hole pipette with a safety pipettor to collect directly from the aeration tank)
Once a week (water): Settlement characteristics of activated sludge (measured by collecting 70 mL in 100 mL test tube), BOD, TOC in treated water
(4)遺伝子解析
活性汚泥微生物群のDNAを抽出し、1) 16S-rRNA断片をPCR法によって増幅し、2) DGGE法により展開し、3) 得られた各バンドを切り出してシーケンス解析による微生物群の構成を検索した。本法の詳しい説明は別のページで記載することとし、ここでは省略する。
(4) Gene analysis
DNA tests of activated sludge microbial group were done by 1) amplifying 16S-rRNA fragment by PCR method, 2) developing by DGGE method, 3) cutting out each obtained band and searching for microbial group composition by sequence analysis. A detailed description of this method will be given on another page and will not be repeated here.
3. Results
(1) Number of experimental days
The experimental period for each DO setting was 200 days or longer. During the whole experiment period, sludge was not extracted except for measurement sampling.
(2)活性汚泥の状況
空気曝気系と酸素曝気系の活性汚泥の沈降特性の一例を写真2に示す。
空気曝気系では、沈降界面が明確でなく、上済み液中に解体した汚泥が存在した。酸素曝気系では、汚泥界面が明確で、上澄み液中に解体汚泥は殆ど存在しない。(沈殿池の基礎-図1、参照)
全ての実験期間中、このような汚泥の沈降特性は同様な状況であった。このため、空気曝気系では、処理水中に流出汚泥が観測された。
酸素および空気の散気よる両活性汚泥処理も、汚泥引抜なしで実施され、以下の結果となった。
1)酸素システム:活性汚泥は変化を示さず、安定していた。
2)空気システム:活性汚泥は約1か月で劣化し、沈降汚泥の界面が無く、汚泥と処理水を分離できなかった。そこで、新しい汚泥種で再実験を繰り返した。
(2) Status of activated sludge
Photo 2 shows an example of the settling characteristics of activated sludges of air and oxygen systems.
In the air system, the settling blanket interface was not clear, and there was sludge dismantled in the upper liquid. In the oxygen system, the settling sludge interface is clear, and there is almost no demolition sludge in the supernatant. (see Fig.1 in the other page).
The settling characteristics of such sludges for both systems were similar during all experimental periods. Therefore, runoff sludge was observed in the treated water in the air aeration system.
The both of activated sludge operations were carried out with no sludge removal from the systems, resulting in follows.
1) Oxygen system (DO > about 10mg/L): The activated sludge showed no change and was stable.
2) Air system (DO at 1 to several mg/L): the activated sludge deteriorated in about 1 month, and there was no interface of the settling sludge. The sludge could not be separated from the treated water, and the restart experiment was repeated with new sludge seed.
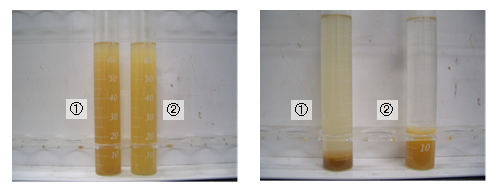
写真2 活性汚泥の沈降特性の一例
(左)観察開始時、(右)圧縮沈降時; ➀:空気曝気系汚泥、➁:酸素曝気系汚泥
Photo 2. An example of settling characteristics of activated sludge.
(Left) Start of observation, (Right) At compression settling; ➀: Air aeration sludge, ➁: Oxygen aeration sludge.
(3)酸素消費量
純酸素および空気の散気のいずれによっても、生物酸化に必要な酸素消費量は同じである。一方、汚濁物質が消失すると、DOは急激に上昇する(別ページVの図1を参照)。このとき、飽和に達したDO値は、酸素分圧と酸素移動係数に依存する。
以上のことから、純酸素の散気量とDOの設定値に間に大きな差異はない。このことから、高酸素濃度型活性汚泥において、酸素ガス消費量は設定DOに大きく依存することはない。高いDO設定においては、僅かな酸素ガスの供給量の増加のみである。
(3) Oxygen consumption
The oxygen consumption required for bio-oxidation is the same for both pure oxygen and air aeration. On the other hand, when the pollutant disappears, DO rises sharply (see Fig.1 on page V). At this time, the DO value that has reached saturation depends on the oxygen partial pressure and the oxygen transfer coefficient.
From the above, there is no big difference between the amount of pure oxygen diffused and the set value of DO. From this, in high oxygen concentration type activated sludge, the oxygen gas consumption does not greatly depend on the set DO. At high DO settings, there is only a slight increase in oxygen gas supply.
(4)DOとMLSSの関係
3Lの小型密封容器であるため、電磁弁の開閉による正確なDO制御は困難であった。特に、DOの計測は混合液を外部測定セット(図4)に循環して行ったため、応答に対する時間的な遅れが大きな要因と考えられる。目標とするDO値に対する実際のDO値は、その設定値が高くなるほど、そのDOの振れ幅が大きくなった。MLSSも測定誤差に加えて、数十日単位での変動幅が観測された。
図5にDOとMLSSの関係を示す。この関係図から、DOが15mg/L前後を境に、DOとMLSSの関係に大きな差異が認められる。
(4) Relationship between DO and MLSS
Since it is a small 3L sealed container, accurate DO control by opening and closing the solenoid valve was difficult. In particular, the DO measurement was performed by circulating the mixed liquor through an external measurement unit (Fig.4), so the time delay with respect to the response is considered to be a major factor. As for the actual DO value with respect to the target DO value, the higher the set value, the larger the fluctuation range of the DO. For MLSS, in addition to the measurement error, a fluctuation range of several tens of days was also observed.
Fig.5 shows the relationship between DO and MLSS. From this relationship diagram, there is a large difference in the relationship between DO and MLSS below and above DO 15mg/L.
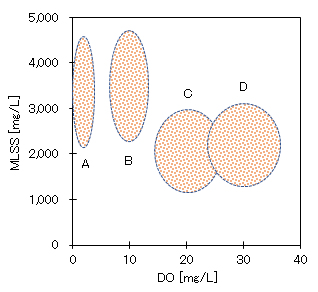
図5 溶存酸素濃度DOと活性汚泥濃度MLSSとの関係図
A:空気曝気、B~D:酸素曝気
Fig.5. Relationship between dissolved oxygen concentration DO and activated sludge concentration MLSS.
A: Air aeration, B to D: Oxygen aeration
(5)微生物群の遺伝子解析
PCR-DGGE法の一例を写真3に示す。この解析事例は、DOの設定値を2mg/L(空気)、10mg/L(酸素:窒素 = 4:1)、15mg/L(酸素)に対するものである。酸素・窒素混合ガスの実験は、実用化における吸着分離式酸素発生装置による酸素曝気を想定したものである。
各DOにより、活性汚泥の微生物群の構成パターンは、いずれも大きく異なっている。空気曝気と混合ガスでは、同一種が多く認められるが、酸素曝気では前記2例とは異なる生物種が少なからず存在する。
参考までに、酸素曝気系の確認できた生物種の存在比(%)は、Haliscomenobacter 33、Ferruginibacter 14、Pontibactor 7、Acidovorax 6、Fluviicoda 4であった。
なお、微生物群の遺伝子解析は、1) 同一の生物群相が各実験系DO環境の変化に対応したものか、2) DO環境に適した新たな生物群相が構成されたものか、を確認することが目的であった。
(5) Genetic analysis of microbial community
Photo 3 shows an example of the PCR-DGGE method. This analysis case is for DO set values of 2mg/L (air), 10mg/L (oxygen:nitrogen = 4:1), and 15mg/L (oxygen). The experiment of the oxygen/nitrogen mixed gas is based on the assumption of oxygen aeration by the adsorption separation type oxygen generator in an actual use.
The composition pattern of the microbial community of activated sludge is greatly different depending on each DO. In air aeration and mixed gas, the same species are often found, but in oxygen aeration, there are some species different from the above two cases.
For reference, the abundance ratio (%) of the biological species in which the oxygen system was confirmed was Haliscomenobacter 33, Ferruginibacter 14, Pontibactor 7, Acidovorax 6, and Fluviicoda 4.
For genetic analysis of microbial communities, the test purpose was to confirm whether 1) the same biota corresponds to changes in the DO environment of each experimental system, or 2) a new biota suitable for the DO environment is constructed.
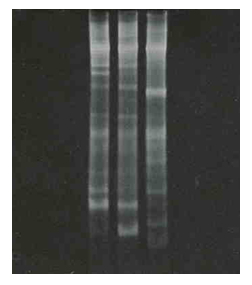
写真3 16S-rDNA解析(PCR-DGGE法)による活性汚泥・微生物群の比較
(左)空気曝気(DO 2mg/L)、(中)混合ガス(酸素:窒素 = 1:4)曝気(DO 10mg/L)、(右)酸素曝気(D0 15mg/L)
Photo 3. Comparison of activated sludge and microbial community by 16S-rDNA analysis (PCR-DGGE tests).
(Left) Air aeration (DO 2mg/L), (Middle) Mixed gas (Oxygen: Nitrogen = 1:4) Aeration (DO 10mg/L), (Right) Oxygen aeration (D0 15mg/L)
(6)処理水
処理水貯留槽の上澄み液中のBODおよびTOCを測定したところ、全ての実験系・期間中、90%以上の除去率であり、この除去率の範囲において大きな差異は認められなかった。
処理水のpHは、空気曝気系ではpH6.5前後、酸素曝気系では8.0前後であった。この差異は、散気中の炭酸ガスの有無によるもと思われる。
(6) Treated water
When BOD and TOC in the supernatant of the treated water storage tank were measured, the removal rate was 90% or more during all experimental conditions and periods, and no significant difference was observed in the range of this removal rate.
The pH of treated water was around 6.5 in the air system and around 8.0 in the oxygen system. This difference seems to be due to the presence or absence of carbon dioxide in the air.
4.結論と課題
(1)まとめ
この一連の実験結果より、次の事項が定性的に確認できた。
①酸素曝気では、沈降界面が明確で沈降分離効率が良好な活性汚泥であった。
②曝気槽内のDO15mg/L前後を堺に、活性汚泥の微生物群の構成が大きく変化する。
③高溶存酸素系では、余剰汚泥の抜取りなし(細胞合成量≒自己酸化量)系が維持できる。
(2)課題
小型密封容器での実験系であったので、DOおよびMLSSの変動幅が大きく、また、物質収支の数量化が不可能で、設計・運転条件の数値化が困難であった。スケールアップした検証実験が必要である。
4. Conclusion and Future Task
(1) Conclusion
From the results of this series of experiments, the following items were qualitatively confirmed.
1) In oxygen aeration, the activated sludge had a clear blanket interface and good settling efficiency.
2) The composition of the microbial community of the activated sludge changes drastically when the DO in the aeration tank is around 15 mg/L.
3) With a high dissolved oxygen system, a system without excess sludge removal (cell synthesis amount ≈ autooxidation amount) can be maintained.
(2) Future task
Since it was an experimental system with a small sealed container, the fluctuation range of DO and MLSS was large, and it was difficult to quantify the mass balance, making it difficult to quantify the design and operating conditions.Scale-up verification experiments are needed.
参考文献
1) 環境技術学会、2007年5月号:特集「汚泥減量化技術とコストダウン」
2) 日本下水道事業団、昭和56年: 酸素活性汚泥法の評価に関する第3次報告書
3) UNOXシステム・カタログ:酸素曝気方式活性汚泥システム
References
1) Society of Environmental Conservation Engineering, May 2007: Special Feature “Sludge Reduction Technology and Cost Reduction”.
2) Japan Sewage Works Agency, 1981: Third Report on Evaluation of Oxygen Activated Sludge Method.
3) UNOX System Catalog: Oxygen aeration activated sludge system.
掲載日:2017年05月30日
更新日:2020年08月12日 (英語版を追加)
Published: May 30. 2017.
Updated: August 12, 2020 (English version added).
