Agriculture and environment – Food self-sufficiency in Japan
村上定瞭(水浄化フォーラム), Sadaaki Murakami (Water & Solutions Forum)
注)目次のうち、リンクがない項目は「掲載準備中」である。適宜、掲載するので更新日に留意されたい。
2. Nitrogen circulation in Japan
3. Nitrogen environmental capacity of soil
4. Livestock excreta and environmental pollution
5. Environmental pollution of outflow nitrogen
6. Cultivated soil and global warming
Note) In the table of contents, the items without links are “preparing for publication“. Please note the update date as it will be posted as appropriate.
現代では、多くの先進国で農業による環境汚染が問題になっている。耕地に投人される養分量が土壌の養分保持能力を上回り、余剰の養分が周辺の地下水・河川や大気に流出し、水質汚濁や温暖化などの環境汚染が発生している。我が国でも地下水の硝酸態窒素汚染は確実に進行している[熊澤、1998]。特に、家畜ふん尿に由来する窒素が大きく関与している[賓示戸ら、2003]。いずれにしても、耕地をめぐる養分循環が破綻した結果である。
本ページでは、農業と環境問題について、多数の調査研究と公的データ量が豊富な窒素を取り上げることとした。
In modern times, environmental pollution due to agriculture has become a problem in many developed countries. The amount of nutrients thrown in cultivated land exceeds the nutrient retention capacity of the soil, surplus nutrients flow into surrounding groundwater, rivers, and the atmosphere, causing environmental pollution such as water pollution and global warming. Nitrate-nitrogen contamination of groundwater is steadily progressing in Japan [Kumazawa, 1998]. In particular, nitrogen derived from livestock excreta is greatly involved [Hinjito et al., 2003]. In any case, this is the result of the failure of the nutrient cycle over the cultivated land.
This page deals with nitrogen, which has a large amount of research and public data on agriculture and environmental issues.
1.食料自給率
日本人の1人1日あたりの熱量摂取量は、1947年の1,856kcalから増加し、1971年には2,287kcalと最大となっているが、その後、減少しつつある(図1-1)。また、この半世紀の間に米の消費量は大きく減少し、その減少分は畜産物(肉類・鶏卵・乳製品など)と油脂類(大豆油・菜種油など)の消費拡大に変わっている(図1-5)。総供給熱量はそれほど変化していないが、自給率が大きく低下したのが魚介類・野菜・小麦・大豆・果実と「その他」に区分される品目である。このような食料の消費形態の変化や品目別の自給率の低下は、国民の食傾向がご飯と魚という「和風」から、パン・パスタ・乳肉製品という「洋風」へ変化したことによる。加えて、消費者の望む多種多様な食料が輸入されていることも我が国の自給率低下に拍車をかけている。
我が国では、1960年に、(1) 所得倍増計画による経済成長の政策決定、(2) 農業基本法の制定が行われた。当時、我が国の食料自給率(供給熱量換算:カロリーベース、以下、同様)と食用穀物(米・麦のうち、飼料用を除いたもの)自給率は、いずれも80%程度であった。ところが、それ以降、自給率は低下し続け、2000年以降の食料自給率は40%前後で推移している(図1-3)。食用穀物自給率も同じで、2000年以降では28%前後で推移している。このような自給率は、主要先進国の中でも、極めて低い値である(図1-4)。過去50年間、我が国の食料自給率を低下させた主な要因は、(1) 食料を国内で賄うという基本姿勢が維持されなかったことと、(2) 食料の消費形態が変化したことであろう。
1. Food self-sufficiency rate
The daily caloric intake of the Japanese people increased from 1,856 kcal in 1947 to 2,287 kcal in 1971, but it was decreasing thereafter (Fig.1-1). Also, over the last half century, rice consumption has fallen sharply, and the decrease has been due to increased consumption of livestock products (meat, chicken eggs, dairy products, etc.) and fats (soybean oil, rapeseed oil, etc.) (Fig.1-5). The total amount of calorie supplied has not changed much, but the self-sufficiency rate has fallen sharply for seafood, vegetables, wheat, soybeans, fruits, and other items. Such changes in food consumption patterns and declines in the self-sufficiency rate by item are due to the change in the national eating habits from the Japanese style of rice and fish to the Western style of bread, pasta and dairy products. In addition, the wide variety of food items that consumers desire are being imported, which is contributing to the decline in Japan’s self-sufficiency rate.
In Japan, in 1960, (1) a policy for economic growth based on the income doubling plan was established, and (2) the Basic Agricultural Law was enacted. At that time, Japan’s food self-sufficiency rate (calculated calorie value, calorie-based, the same below) and food grains (rice and wheat excluding those for feed) were both around 80%. However, since then, the self-sufficiency rate has continued to decline, and since 2000 the food self-sufficiency rate has been around 40% (Fig.1-3). The edible grain self-sufficiency rate is the same, and has been around 28% since 2000. Such a self-sufficiency rate is extremely low among the major developed countries (Fig.1-4). The main factors that have reduced Japan’s food self-sufficiency rate over the past 50 years are (1) the lack of a basic attitude of supplying food domestically, and (2) changes in food consumption patterns.
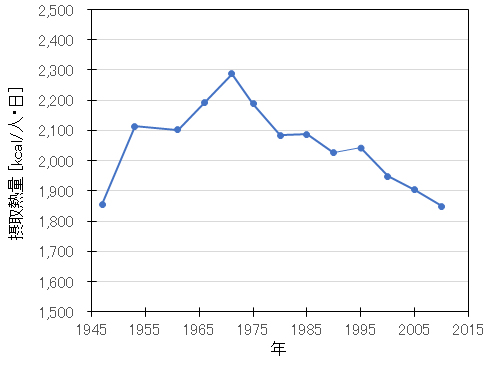
図1-1 日本人の1人1日あたりの摂取カロリーの推移 [厚生労働省ー国民栄養調査]
Fig.1-1 Changes in daily calorie intake of Japanese people [Ministry of Health, Labor and Welfare-National Nutrition Survey]
目次へ To Table of contents
食料自給率の定義
-農林水産省(website, 2020)より抜粋-
食料自給率とは、我が国の食料全体の供給に対する国内生産の割合を示す指標である。その示し方については、単純に重量で計算することができる品目別自給率と、食料全体について共通の「ものさし」で単位を揃えることにより計算する総合食料自給率の2種類がある。このうち、総合食料自給率は、熱量で換算するカロリーベースと金額で換算する生産額ベースがある。
Definition of food self-sufficiency rate-
– Excerpt from Ministry of Agriculture、Forestry and Fisheries (website, 2020) –
The food self-sufficiency ratio is an index showing the ratio of domestic production to the total food supply of Japan. There are two types of indications: the self-sufficiency ratio by item, which can be calculated simply by weight, and the total food self-sufficiency ratio , which is calculated by aligning the units with a common “measurement” for all food items . Of these, the total food self-sufficiency rate is divided into calories based on hesrt (energy) and production based on money.
以下の算定式により、各品目における自給率を重量ベースで算出している。なお、品目別自給率では、食用以外の飼料や種子等に仕向けられた重量を含んでいる。
国内消費仕向量=国内生産量+輸入量-輸出量-在庫の増加量(又は+在庫の減少量)
例)小麦の品目別自給率(2018年度)
=小麦の国内生産量(76.5万トン)/小麦の国内消費仕向量(651.0万トン)
=12%
The self-sufficiency rate for each item is calculated on a weight basis using the following formula. The self-sufficiency rate by item includes the weight destined for non-edible feed and seeds.
Domestic consumption volume = Domestic production volume + Import volume-Export volume-Inventory increase amount (or + Inventory decrease amount)
Example) Wheat self-sufficiency ratio by item (2018 Fiscal year)
= Domestic production of wheat (765,000 tons) / Domestic consumption of wheat (651,000 tons)
= 12%
食料全体について単位を揃えて計算した自給率として、供給熱量(カロリー)ベース、生産額ベースの2とおりの総合食料自給率を算出している。畜産物については、輸入した飼料を使って国内で生産した分は、総合食料自給率における国産には算入していない。
As a self-sufficiency ratio calculated for all foods in uniform units, two types of comprehensive food self-sufficiency are calculated: the amount of heat supplied (calories) and the amount of production. As for livestock products, domestic production using imported feed is not included in domestic production in the total food self-sufficiency ratio.
カロリーベース総合食料自給率は、基礎的な栄養価であるエネルギー(カロリー)に着目して、国民に供給される熱量(総供給熱量)に対する国内生産の割合を示す指標である。
=1人1日当たり国産供給熱量(912kcal)/1人1日当たり供給熱量(2,443kcal)
=37%
分子及び分母の供給熱量は、「日本食品標準成分表2015」に基づき、各品目の重量を熱量(カロリー)に換算したうえで、それらを足し上げて算出している。
The calorie-based total food self-sufficiency ratio refers to the ratio of domestic production to the amount of heat supplied to the people (total amount of heat supplied), focusing on the basic nutritional value, energy (calories). It is an index to show.
= Domestic heat supply per person per day (912kcal) / Heat supply per person per day (2,443kcal)
= 37%
The amount of heat supplied to the numerator and denominator is calculated by converting the weight of each item into the amount of heat (calories) based on the “Japanese Food Standard Ingredient Table 2015” and then adding them up.
生産額ベース総合食料自給率は、経済的価値に着目して、国民に供給される食料の生産額(食料の国内消費仕向額)に対する国内生産の割合を示す指標である。
=食料の国内生産額(10.6兆円)/食料の国内消費仕向額(16.2兆円)
=66%
分子及び分母の金額は、「生産農業所得統計」の農家庭先価格等に基づき、各品目の重量を金額に換算したうえで、それらを足し上げて算出している。
The production-based total food self-sufficiency rate refers to the ratio of domestic production to the production value of food supplied to the people (domestic consumption consumption amount of food), focusing on economic value. It is an index to show.
(FY2018)
= Domestic food production (10.6 trillion yen) / Food domestic consumption (16.2 trillion yen)
= 66%
The numerator and denominator amounts are calculated by converting the weight of each item into a monetary amount based on the prices of farm households in the Statistics of Producing Agricultural Income and adding them up.
食料国産率は、我が国畜産業が輸入飼料を多く用いて高品質な畜産物を生産している実態に着目し、我が国の食料安全保障の状況を評価する総合食料自給率とともに、飼料が国産か輸入かにかかわらず、畜産業の活動を反映し、国内生産の状況を評価する指標である。令和2年3月に閣議決定された食料・農業・農村基本計画で位置付けられている。総合食料自給率が飼料自給率を反映しているのに対し、食料国産率では飼料自給率を反映せずに算出している。
=1人1日当たり国産供給熱量(1,129kcal)/1人1日当たり供給熱量(2,443kcal)
=46%
生産額ベース食料国産率(2018年度)
=食料の国内生産額(11.2兆円)/食料の国内消費仕向額(16.2兆円)
=69%
The domestic food production rate is a comprehensive food self-sufficiency rate that evaluates the state of food security in Japan, focusing on the fact that the Japanese livestock industry produces high-quality livestock products using a large amount of imported feed. At the same time, it is an index that reflects the activity of the livestock industry and evaluates the state of domestic production, regardless of whether domestic feed or imports. It is positioned in the Food, Agriculture and Rural Basic Plan, which was decided by the Cabinet in March 2013. While the total food self-sufficiency rate reflects the feed self-sufficiency rate, the food domestic production rate is calculated without reflecting the feed self-sufficiency rate.
= Domestically produced heat supply per person per day (1,129kcal) / Heat supply per person per day (2,443kcal)
= 46%
Domestic food production rate based on production value (FY2018)
= Domestic food production Amount (11.2 trillion yen) / Food for domestic consumption (16.2 trillion yen)
= 69%
飼料自給率は、畜産物に仕向けられる飼料が、国内でどの程度賄われているかを示す指標である。
=純国内産飼料生産量(619万TDNトン)/飼料需要量(2,452万TDNトン)
=25%
分子及び分母の数量は、「日本標準飼料成分表等」に基づき、各飼料の重量をTDN(可消化養分総量)に換算したうえで、それらを足し上げて算出している。
The feed self-sufficiency rate is an index that shows how much domestic feed for livestock products is covered.
= Net domestic feed production (61.9 million TDN tons) / Feed demand (24.52 million TDN tons)
= 25%
The numbers of numerator and denominator are calculated by converting the weight of each feed to TDN (total digestible nutrients) based on the “Japanese Standard Feed Ingredient Table, etc.” and adding them up.
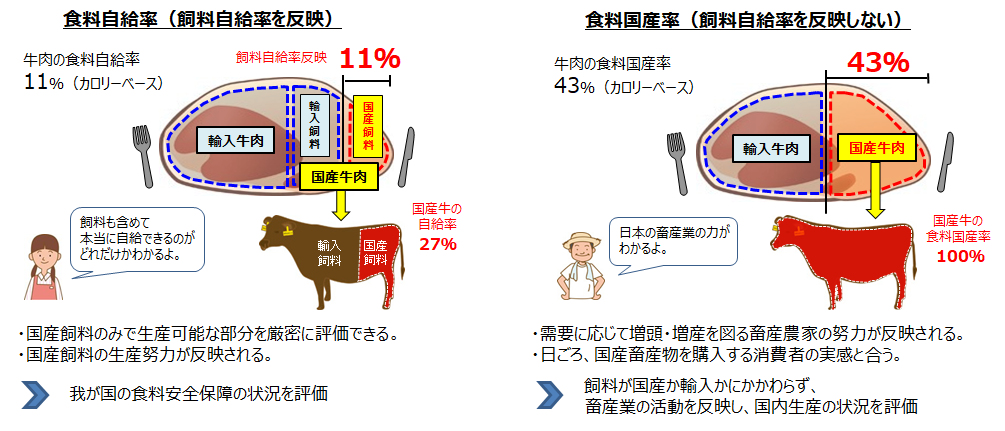
図1-2 食料国産率に関する解説図
Fig.1-2 Explanatory diagram of food production rate
日本の食料自給率
(1) 日本の食料自給率の状況
2018年度の食料自給率は、カロリーベースで37%、生産額ベースで66%となっている。また、食料国産率は、カロリーベースで46%、生産額ベースで69%、飼料自給率は25%となっている。
(2) 食料自給率の推移
我が国の食料自給率は、自給率の高い米の消費が減少し、飼料や原料を海外に依存している畜産物や油脂類の消費量が増えてきたことから、長期的に低下傾向で推移してきたが、カロリーベースでは近年横ばい傾向で推移している。
Japan’s food self-sufficiency rate
(1) Japan’s food self-sufficiency ratio
In fiscal 2018, the food self-sufficiency ratio was 37% on a calorie basis and 66% on a production value basis. The food production rate was 46% on a calorie basis, 69% on a production value basis, and the feed self-sufficiency rate was 25%.
(2) Changes in food self-sufficiency ratio
Japan’s food self-sufficiency ratio is due to a decrease in consumption of rice, which has a high self-sufficiency ratio, and an increase in consumption of livestock products and oils and fats that depend on feed and raw materials overseas. Although it has been declining over the long term, it has been declining in recent years on a calorie basis.
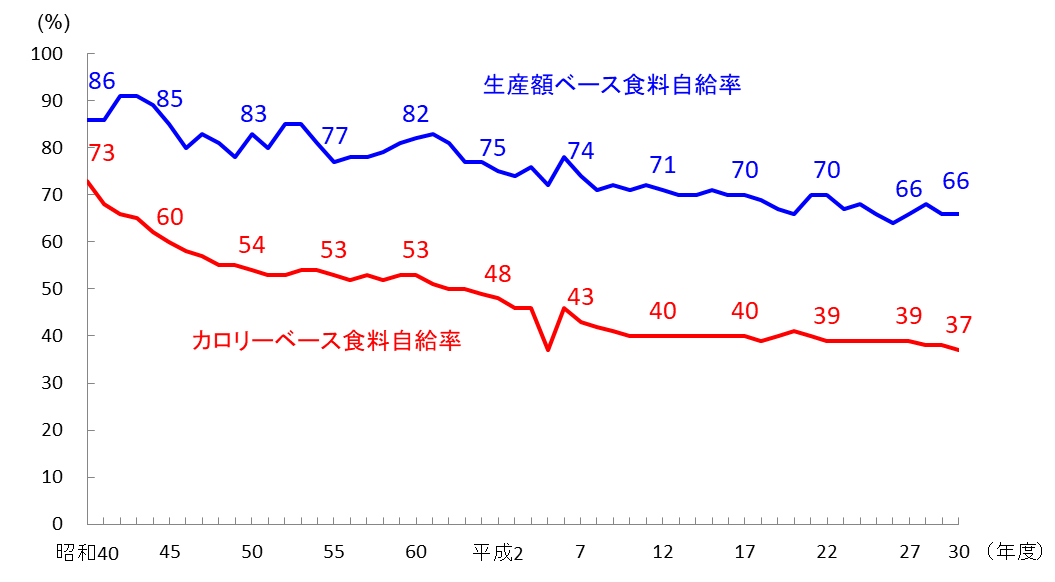
図1-3 食料自給率の推移
Fig.1-3 Changes in food self-sufficiency rates
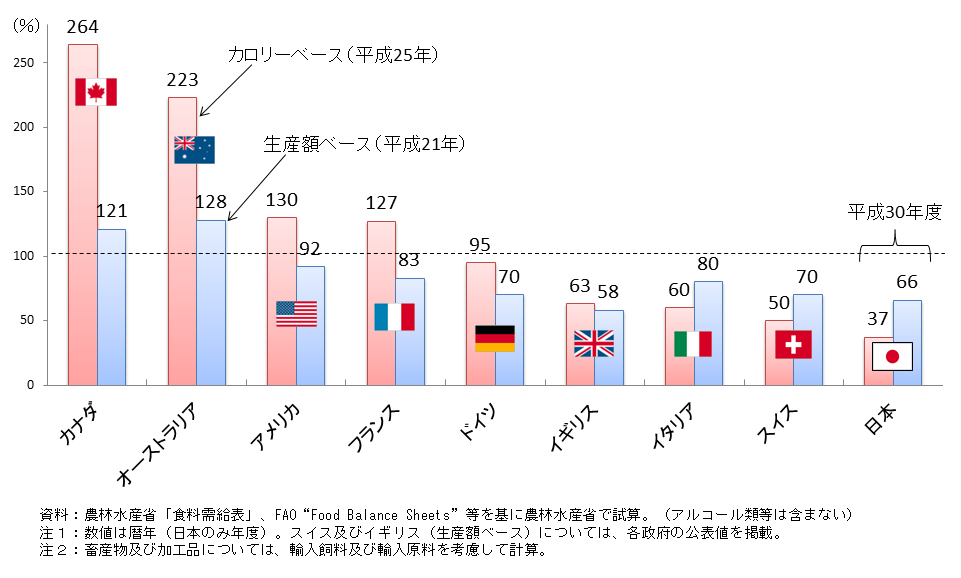
図1-4 主要先進国の食料自給率の試算
Fig.1-4 Estimated food self-sufficiency rates in major developed countries
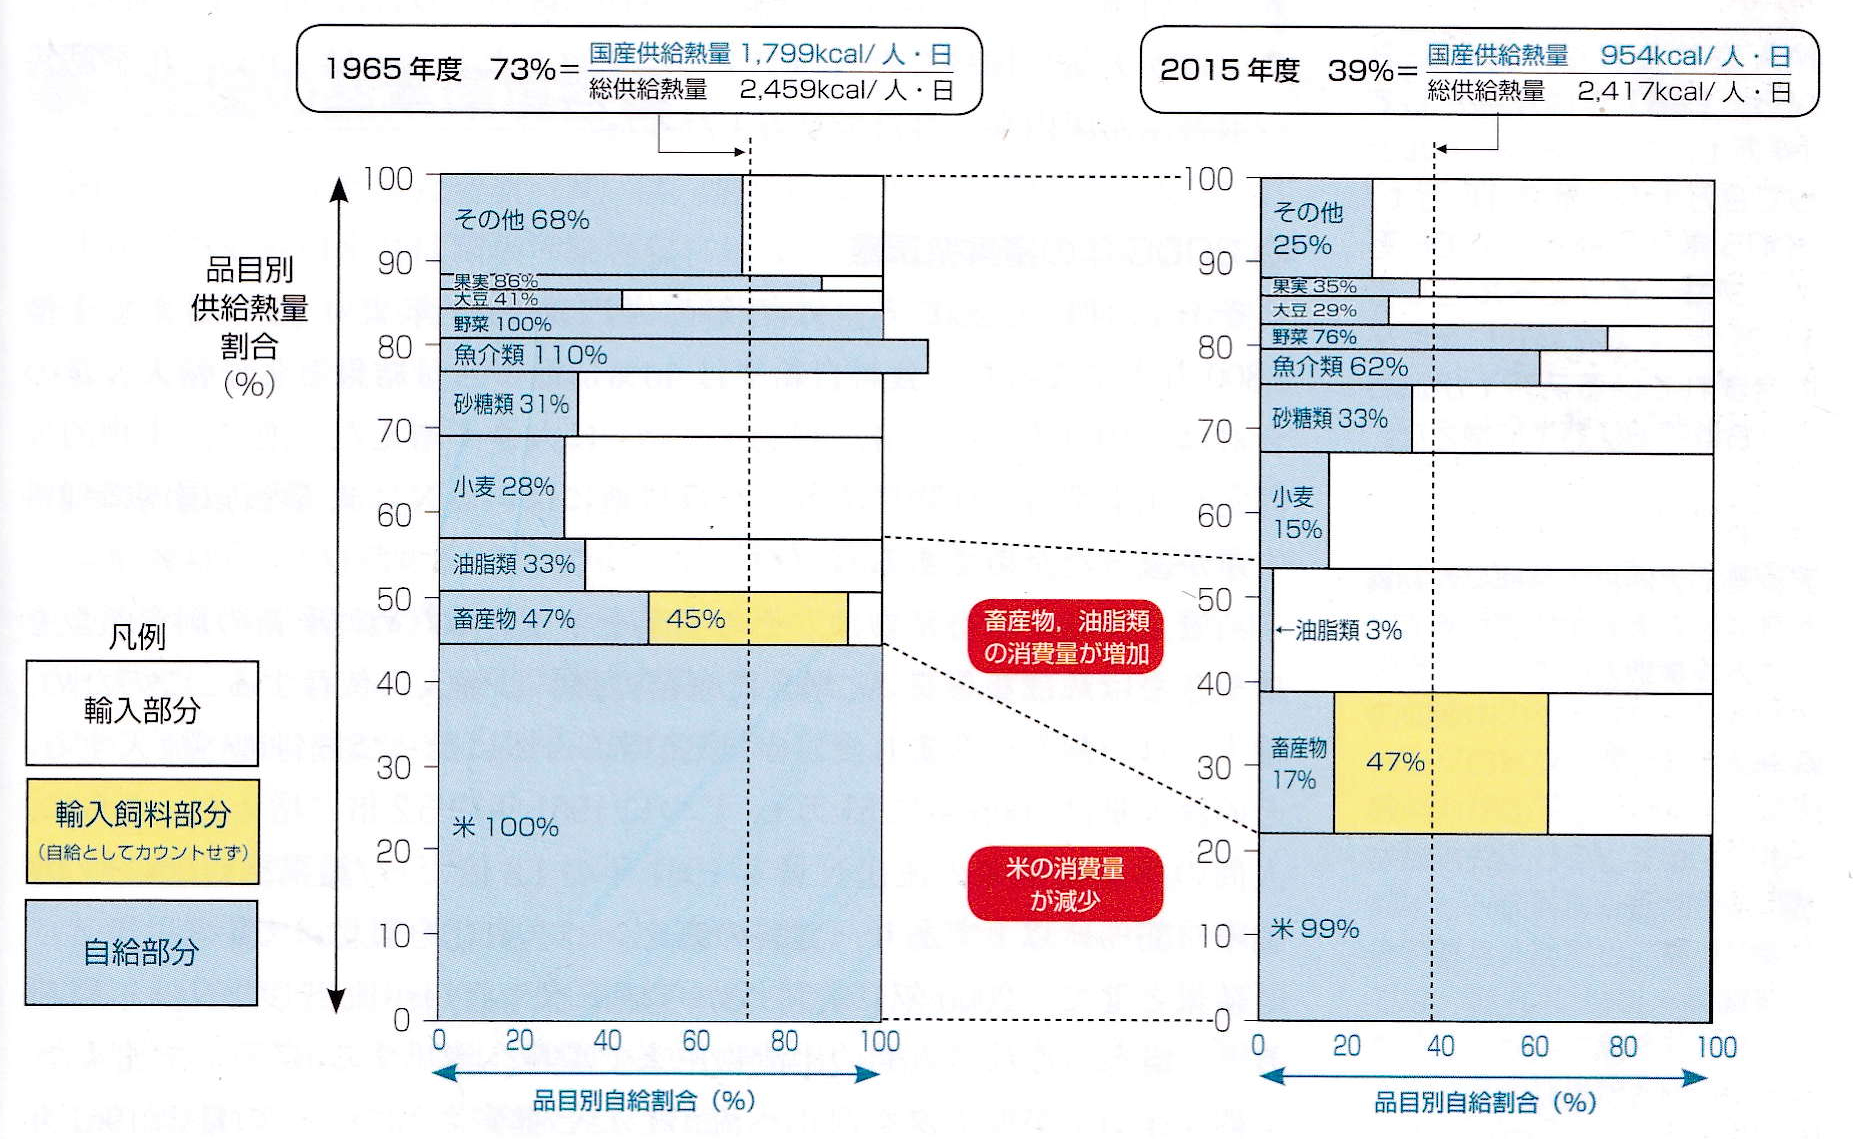
図1-5 我が国の総合食料自給率と品目別自給率の50年間の変化(供給熱量ベース)
Fig.1-5 Changes in Japan’s total food self-sufficiency rates and self-sufficiency rates by item in 50 years (on a heat supply basis)
参考文献
熊澤喜久雄:地下水の硝酸態窒素汚染の現況、日本土壌肥料学雑誌、70, pp.207-213(1999)
賓示戸雅之・他6名:わが国農耕地のおける窒素負荷の都道府県別負荷と改善シナリオ、日本土壌肥料学雑誌、74, pp.467-474(2003)
目次へ
References
Kikuo Kumazawa: Present state of nitrate nitrogen pollution in groundwater, Japanese Journal of Soil Science and Plant Nutrition, 70 , pp.207-213 (1999) (in Japanese)
Masayuki Hinjito, et al.: Load and improvement of nitrogen load on agricultural land in Japan by prefecture Scenario, Japanese Journal of Soil Science and Plant Nutrition, 74 , pp.467-474 (2003) (in Japanese)
To Table of contents
更新日:
Updated:
